
Greenhouse Gases: What every college student should know
There’s really no debate in the scientific community that climate change is occurring or that its effects are being driven by human emissions of greenhouse gases, which get trapped in the atmosphere and increase the average temperature of the globe.
What’s less well understood is exactly how these inputs will affect us, our descendants or the other inhabitants of the planet.
A glance through Earth’s atmospheric history emphasizes just how dramatically human beings have increased greenhouse gas emissions since the Industrial Revolution, when the burning of fossil fuels and the intensification of agriculture became widespread.
To assemble the atmosphere’s biography, scientists conducted studies at places like Vostok, Antarctica, where the formation of slow-forming glaciers has captured ancient air samples between layers of solid ice.
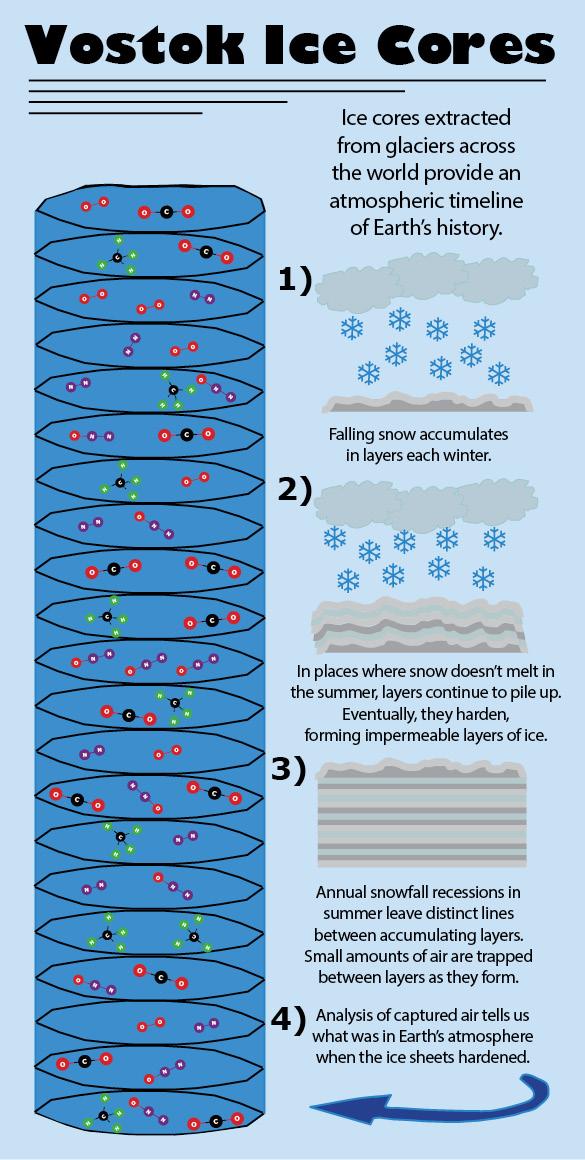
The process, though not without limitations, is one of the most ingenious ways humankind has made use of the existing environment to learn about what it was like in the past.
Combining data from overlapping ice cores, scientists have assembled an 800,000-year-long history of Earth’s atmospheric makeup. How this record differs from current greenhouse gas concentrations shows just how strongly — and how quickly — the presence of human culture has influenced the world’s atmospheric contents and, in turn, its climate.
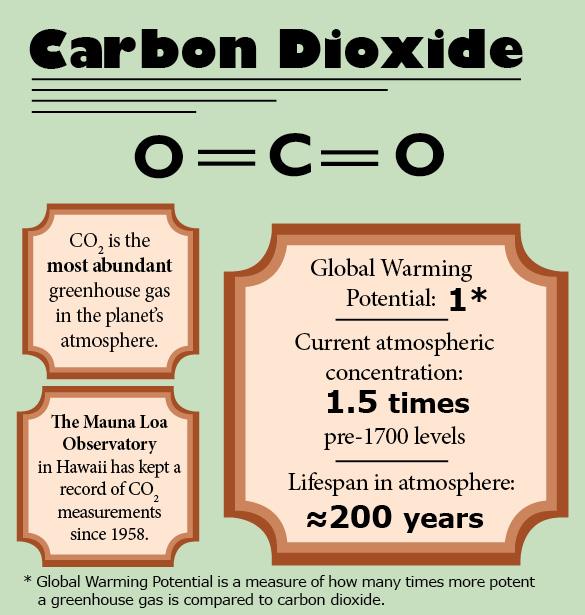
Of the three major molecules we call greenhouse gases, carbon dioxide (CO2) is the most abundant in the atmosphere.
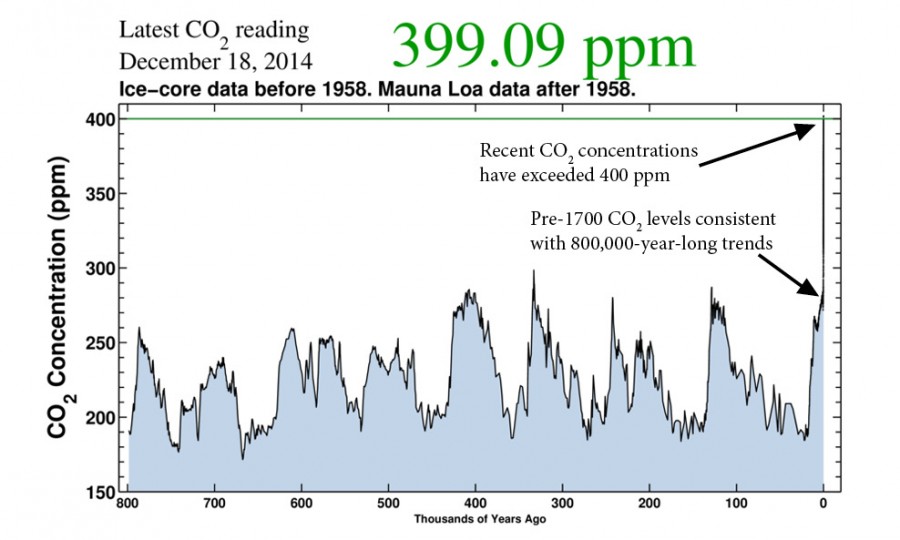
The ice core data show that CO2 concentrations in the atmosphere fluctuated between about 180 ppm (parts per million) and 280 ppm in 100,000-year-long cycles for nearly the last one million years.1 When human beings arrived on the scene, CO2 levels had just reached the upper crest of one of these fluctuations and were ready to fall once more.
But not only have we not seen the beginnings of an expected decrease, we’ve actually recorded massive increases; the current CO2 concentration of the atmosphere has now surpassed more than 400 ppm.
Though the unprecedentedly high concentration is startling enough, it’s the speed at which it has risen that is making the effects of climate change dangerously unpredictable.
At it’s most rapid accumulation rate in the ice core data, CO2 levels in the atmosphere increased by about 75 ppm over 25,000 years. Twice that amount has been added to the atmosphere today since the effects of the Industrial Revolution just 200 years ago.
In other words, the atmosphere is accumulating CO2 more than 200 times faster than it ever has in the last million years — all at a time when it should be starting to decrease. And as the human population grows, it’s expected to accelerate to almost 700 times faster than pre-human rates in just another century without mitigation.2
But how do we know CO2 levels are rising because of humans?
Though CO2 is released in massive doses naturally during volcanic activity — up to 500 million tons of it each year — that’s less than 2 percent of the 30 billion tons humans emit annually burning fossil fuels.3
Because CO2 molecules from different sources have unique isotopic signatures,4 scientists can identify where CO2 in the atmosphere comes from, and the exact amount we know we burn in fuel consumption each year matches the amount in the atmosphere that bears the human signature.
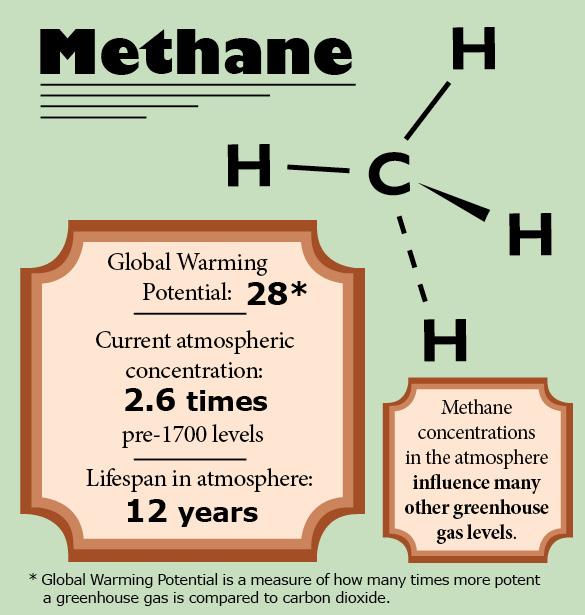
The second most abundant greenhouse gas in the atmosphere is methane (CH4), an important player in the nitrogen cycle crucial to plant and microbial life.
It’s also a waste product of most livestock digestion, and with U.S. dependence on a heavily meat-based diet, livestock production is one of the country’s leading contributors to climate change.
In fact, new data from a methane-detecting satellite suggests methane release by livestock has been vastly under reported and may actually account for 30 percent of all anthropogenic greenhouse gas emissions worldwide. 5
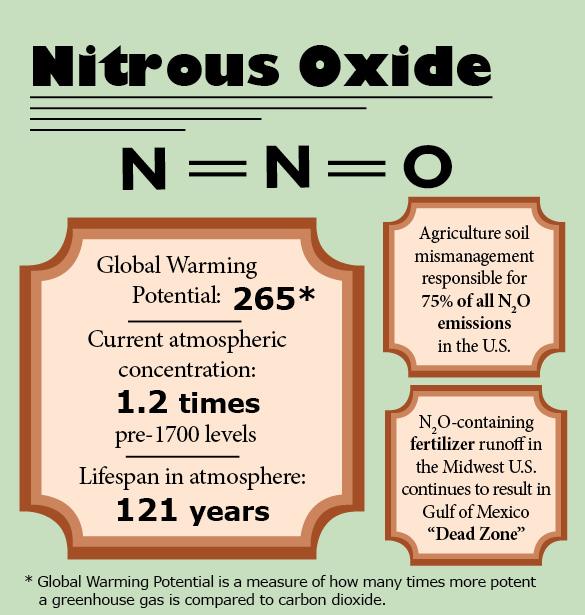
A far more potent greenhouse gas, nitrous oxide (N2O) is a component of nitrogen fertilizer used in agriculture. Fertilizer use accounts for 75 percent of N2O in the atmosphere today.6
Fertilizer runoff in North America also leads to nitrogen buildup in the Gulf of Mexico, resulting in nitrogen-feeding algal blooms proliferating and using up all the dissolved oxygen in the sea. The Gulf “Dead Zone,” which continues to prevent the habitation of virtually all marine life, covered 8,400 square miles at its largest a few years ago.7
Today, it is estimated that 70 percent of the nitrogen contributing to the Dead Zone comes from fertilizer runoff from farms of the American Midwest.8
But what’s the significance of increasing global temperature as a result of greenhouse gas emissions? How might the melting ice caps affect our way of life?
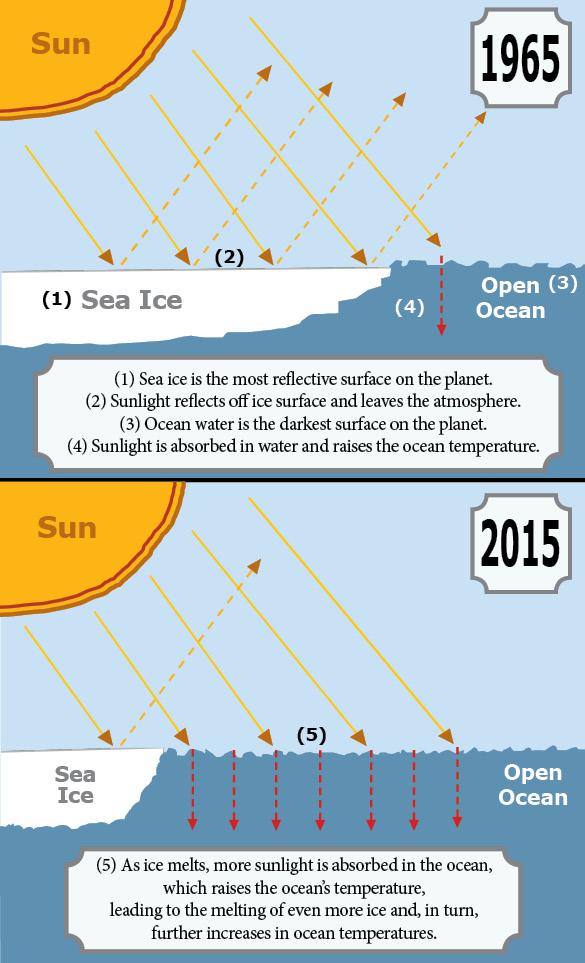
The warming of the ocean and the melting of the ice caps are two symptoms of one event. As such, their relationship affects more than just polar bear habitats — the more ice that melts, the warmer the planet will get, and the more unpredictable global climate will become.
A study published this month shows that the warming of ocean water also is triggering the release of massive stores of methane hydrates off the coast of Washington. The authors say these warming underwater reserves are emitting as much greenhouse methane as did the BP Deepwater Horizon oil spill — each year. Similar reserves have yet to be monitored.9
The global climate system is so vast and complex that human beings will likely never be able to fully predict its behaviors.
Reading the secrets of our atmospheric past in the ice, however, has shown that humans influence the natural factors that regulate climate change more drastically and with more speed than anything has in the last million years — making the actions of our species today some of the most important elements in influencing the future of planet Earth.
References
- https://scripps.ucsd.edu/programs/keelingcurve/
- Climate Interactive CROADS version 3.014 run April 22, 2013 based on confirmed proposals as of April 19, 2013. Retrieved December 20, 2014, from http://co2now.org/Future-CO2/Targets/carbon-targets-for-humanity.html
- Gerlach, T. (2011). Volcanic versus anthropogenic carbon dioxide. EOS, Transactions, American Geophysical Union. 92: 201-208. (http://www1.dst.unipi.it/dst/rocchi/SR/GG_files/CO2-EOS92-24.pdf)
- Schumacher, M., Werner, R., Meijer, H., Jansen, H., Brand, W., Geilmann, H., & Neubert, R. (2011). Oxygen isotopic signature of CO2 from combustion processes. Atmospheric Chemistry and Physics. 11: 1473-1490. Retrieved December 20, 2014, from http://www.atmos-chem-phys.net/11/1473/2011/acp-11-1473-2011.pdf
- Wecht, K., Jacob, D., Frankenberg, C., Jiang, Z., and Blake, D. (2014). Mapping of North American methane emissions with high spatial resolution by inversion of SCIAMACHY satellite data. Journal of Geophysical Research: Atmospheres. 119: 12, 7741-7756. Retrieved December 20, 2014, from http://onlinelibrary.wiley.com/doi/10.1002/2014JD021551/full
- Cavigelli, M., Grosso, S., Liebig, M., Snyder, C., Fixen, P., Venterea, R., Leytem, A., McLain, J., and Watts, D. (2012). US agricultural nitrous oxide emissions: context, status, and trends. Frontiers in Ecology and the Environment 10: 537–546. Retrieved December 20, 2014, from http://dx.doi.org/10.1890/120054
- U.S. Geological Survey. (2012). NOAA: Gulf of Mexico ‘Dead Zone’ predictions feature uncertainty. USGS news release. Retrieved December 20, 2014 from http://www.usgs.gov/newsroom/article_pf.asp?ID=3252
- Robertson, D., Schwartz, G., Saad, D., and Alexander, R. (2009). Incorporating uncertainty into the ranking of SPARROW model nutrient yields from Mississippi/Atchafalaya River basin watersheds. Journal of the American Water Resources Assocation. 45: 2, 534-549. Retrieved December 20, 2014, from http://onlinelibrary.wiley.com/enhanced/doi/10.1111/j.1752-1688.2009.00310.x/
- Hautala, S., Solomon, E., Johnson, H., Harris, R., and Miller, U. (2014). Dissociation of Cascadia margin gas hydrates in response to contemporary ocean warming. Geophysical Research Letters. 41; available online at: 1002/2014GL061606
Will Beaton is the Editor-in-Chief of The Dakota Student. He can be reached at [email protected].